Georgia is one of the most active markets in AuctionData's database. With 366 unit analyses spread across 35 cities, we have enough data to show you what the GA storage auction landscape actually looks like -- not guesses, not vibes, but real scores pulled from real listings. Here's what I've found.
The state average opportunity score sits at 43, with an average wealth score of 56. Median household income across the cities we've analyzed comes in at $83,123, and median home values average $342,439. Those numbers tell a story: Georgia's auction market skews toward middle-to-upper-middle-income suburbs, which generally means decent contents but competitive bidding.
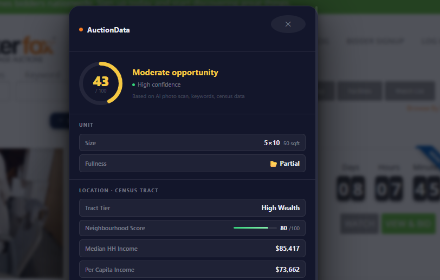
AuctionData scores every listing with AI image analysis, eBay sold prices, and Census neighborhood data.
What the Data Shows
Across the 11 cities with the most analyzed units, opportunity scores range from 32 to 49. That's a tighter band than you might expect, but the differences within that range matter. A score of 49 versus 32 represents a meaningful gap in expected unit quality, neighborhood economics, and resale potential.
Most Georgia cities we've scored land in the 40-49 range -- solid but not exceptional. That's typical for a mature metro market like Atlanta and its surrounding suburbs. The units are there, the contents are generally decent, but you're not finding hidden goldmines on every listing. The buyers who do well here are the ones who use data to find the pockets of opportunity within that 40-49 band and avoid the lower-scoring listings that drag down returns.
Georgia City-by-City Breakdown
| City | Units | Avg Score | Wealth Score | Median Income | Median Home Value |
|---|---|---|---|---|---|
| McDonough | 33 | 49 | 55 | $82,451 | $352,550 |
| Dallas | 12 | 47 | 50 | $90,455 | $293,300 |
| Villa Rica | 21 | 44 | 51 | $87,803 | $266,400 |
| Lawrenceville | 13 | 44 | 46 | $52,011 | $382,600 |
| Newnan | 10 | 44 | 30 | $57,196 | $233,800 |
| Lilburn | 20 | 43 | 45 | $68,476 | $326,300 |
| Atlanta | 33 | 42 | 57 | $83,256 | $352,240 |
| Douglasville | 19 | 42 | 62 | $89,095 | $338,000 |
| Riverdale | 39 | 38 | 29 | $67,674 | $304,100 |
| Carrollton | 16 | 37 | 36 | $59,894 | $262,750 |
| Griffin | 10 | 32 | 15 | $37,885 | $116,700 |
Wealth Score Breakdown
The wealth score is built from Census Bureau data -- specifically median household income and median home values for the zip code and census tract where each storage facility sits. It's not a measure of unit quality directly, but it tells you about the economic profile of the people who rented those units. Higher wealth scores generally correlate with higher-value contents, though that's a trend line, not a guarantee.
In Georgia, wealth scores range from 15 (Griffin) all the way up to 62 (Douglasville). That's a wide spread. Griffin's median income of $37,885 and home values around $116,700 put it firmly in budget territory -- you're more likely to find basic household goods than premium brands. Douglasville, on the other hand, sits at $89,095 median income with $338,000 home values. That's solidly upper-middle, and the unit contents tend to reflect it.
For buyers, the wealth score is a filter. It doesn't tell you whether a specific unit is worth bidding on, but it helps you prioritize which listings deserve your time for a closer look. When I'm scanning Georgia listings, I use the wealth score to triage -- facilities in the 50+ wealth score range get my attention first.
Best Opportunities by City
McDonough leads the pack with an average opportunity score of 49 across 33 analyzed units. That's a solid sample size and the highest average score in the state. Combined with a wealth score of 55, median income of $82,451, and home values over $350K, McDonough hits the sweet spot -- good enough neighborhood economics to produce quality contents, but not so affluent that every buyer in the metro area is fighting over the same listings.
Dallas comes in at 47 with a wealth score of 50. Fewer analyzed units (12) means the data is thinner, but the signal is promising. Dallas sits in Paulding County, far enough from the Atlanta core that competition tends to be lighter. The median income of $90,455 is actually the highest in our Georgia dataset, which suggests the neighborhood demographics are strong even if the sample is smaller.
Both of these cities share a pattern: mid-tier opportunity scores backed by solid wealth fundamentals. They're not flashy, but they're consistent. If you're building a regular buying route in the Atlanta metro, McDonough and Dallas should be on it.
Markets to Watch Carefully
Griffin posts the lowest scores in our Georgia data -- a 32 opportunity score and a wealth score of just 15. With median income at $37,885 and home values at $116,700, the demographic profile suggests lower-value contents as a baseline. That doesn't mean every unit in Griffin is a bust, but the averages are working against you. You need to be more selective here, and your max bid should reflect the lower expected value.
Riverdale has the most analyzed units in the state (39) but an opportunity score of just 38 and a wealth score of 29. Despite being part of the metro Atlanta area, Riverdale's economics are below average for the region. The volume of listings there is high -- which is why we have so many analyses -- but volume doesn't equal quality. If you're buying in Riverdale, you're playing a numbers game where most units need to be passed on to find the ones worth taking.
Neither of these markets is off-limits. But they require more discipline. Lower wealth scores mean your margin for error on bids is thinner, and the average resale value per unit will be lower. Factor that into your bidding ceiling.
Score Georgia listings before you bid -- AuctionData analyzes units on StorageTreasures, LockerFox & StorageAuctions using AI image analysis, neighborhood income data, and keyword signals.
How to Use This Data
Numbers on a page are useful, but they're more useful when you put them to work. Here's how I'd use this Georgia data if I were planning my buying strategy:
- Prioritize by wealth score first. Filter your browsing time toward facilities in cities scoring 50+ on the wealth index. McDonough, Atlanta, Douglasville, Villa Rica, and Dallas all clear that bar. You'll still check other cities, but these get first look.
- Use the opportunity score as a sanity check. If AuctionData scores a specific unit below 35 in an area that already averages low, that's a strong pass signal. If it scores above the city average, it might be worth a closer look.
- Check the heatmap for facility-level patterns. City averages are helpful, but individual facilities within a city can vary. The AuctionData heatmap shows you facility-level data so you can spot the specific locations that outperform their city average.
- Adjust your max bid by market tier. In a McDonough or Dallas listing, you can bid with more confidence in the neighborhood economics. In Griffin or Riverdale, your max bid should be lower to account for the lower baseline value.
- Track your own results. This data shows averages. Your results will vary based on what you buy, what you pass on, and how you sell. Use the scores as a starting point and calibrate against your actual outcomes over time.
Explore More
This is one snapshot of one state. The data updates as more units get analyzed, and the patterns can shift over time as neighborhoods change and auction volume fluctuates.
- Live heatmap -- see facility-level scores and wealth data across every state we cover
- How neighborhood income affects storage auction value
- How to read a storage auction unit before you bid
- How AI is changing storage auction buying