Texas is our second most active market for storage auction analysis. With 267 units scored across 11 cities, we have enough data to start seeing real patterns in opportunity scores, wealth indicators, and where the best buying conditions exist across the state. Most of that volume is concentrated in the San Antonio metro, but the smaller cities tell an interesting story too.
This is all real data from AuctionData analyses — not estimates, not projections, not scraped listing counts. Every number below comes from units that were actually scored by the extension using AI image analysis and Census Bureau neighborhood data.
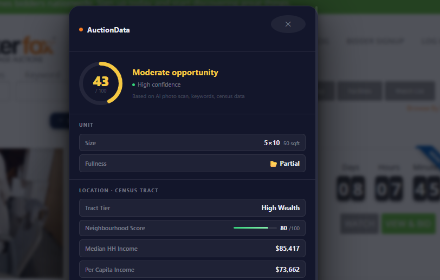
Every listing gets an AI-powered scorecard with item detection, eBay price lookups, and Census neighborhood data.
What the Data Shows
The Texas dataset is heavily concentrated in the San Antonio metro area. San Antonio proper accounts for 127 of our 267 analyses, and neighboring Converse adds another 101. That means about 85% of our Texas data comes from one metro region. This isn't a flaw in the data — it reflects where our users are actively buying and evaluating units.
The statewide average opportunity score sits at 43, which is moderate. Most units in Texas are landing in that 35-50 range where the contents look decent but not exceptional. The top score we've recorded in Texas is 74, which is solid — that's a unit where the AI saw high-value items, good packing quality, and the neighborhood demographics supported the assessment.
The average median income across all Texas cities in our dataset is $78,618, with average home values at $295,725. But those averages mask an enormous range, which is where the data gets interesting.
City-by-City Breakdown
| City | Units | Avg Score | Wealth | Median Income | Home Value |
|---|---|---|---|---|---|
| San Antonio | 127 | 39 | 37 | $65,897 | $231,480 |
| Converse | 101 | 43 | 44 | $86,295 | $251,600 |
| Seguin | 9 | 51 | 46 | $75,250 | $275,500 |
| Spring Branch | 8 | 48 | 94 | $154,496 | $483,500 |
| Arlington | 7 | 39 | 21 | $38,347 | $236,600 |
| Burleson | 5 | 49 | 75 | $106,806 | $359,300 |
| San Marcos | 4 | 43 | 31 | $45,094 | $285,100 |
| Keller | 2 | 41 | 90 | $128,646 | $365,400 |
| Salado | 1 | 63 | 92 | $114,766 | $510,400 |
| Austin | 1 | 40 | 77 | $77,569 | $530,400 |
The Wealth Score Story
If there's one stat that jumps off the page in our Texas data, it's the wealth score range. We're seeing a spread from 21 in Arlington to 94 in Spring Branch — that's about as wide as it gets in any state we track.
The wealth score is derived from Census Bureau data — median household income, median home value, and other economic indicators for the area around each storage facility. A higher wealth score doesn't automatically mean better units, but it does mean the people who originally rented those units had more disposable income. That correlates with higher-quality items being stored.
Spring Branch is the standout here. With a median household income of $154,496 and median home values pushing $483,500, it's a wealthy Hill Country community northwest of San Antonio. Units from facilities in areas like this tend to contain higher-end furniture, better electronics, and more name-brand items. The 94 wealth score reflects that economic reality.
On the other end, Arlington's wealth score of 21 corresponds to a median income of just $38,347. That doesn't mean every unit there is junk — you can still find profitable units in lower-income areas, especially if competition is lower. But the baseline expectation for item quality is different, and your bidding strategy should reflect that.
For more on how neighborhood economics affect unit value, see the breakdown on neighborhood income and storage auction value.
Hidden Gems in the Data
The highest-volume cities aren't necessarily the best places to buy. When I look at this data, three smaller markets stand out.
Seguin — Score 51, Wealth 46
Seguin is a small city east of San Antonio with only 9 units in our dataset. But it posted the highest average opportunity score of any Texas city with meaningful volume — 51. The wealth score is moderate at 46, which puts it in that sweet spot where items are decent quality but you're not competing against buyers who are cherry-picking only the premium stuff. Median income of $75,250 supports that middle-ground thesis.
Burleson — Score 49, Wealth 75
Burleson sits south of Fort Worth in the DFW metro. Five units scored, average of 49 with a wealth score of 75. That wealth score is driven by a median income of $106,806 and home values around $359,300. This is a suburb where families have money, and the contents of abandoned storage units tend to reflect that. If you're buying in the DFW area, Burleson-area facilities are worth watching.
Spring Branch — Score 48, Wealth 94
I already mentioned Spring Branch for its wealth score, but it's worth calling out as a buying opportunity too. The opportunity score of 48 paired with that 94 wealth score is a compelling combination. It means the AI is seeing decent-to-good contents in a very wealthy area. Eight units is a small sample, but the signal is there — affluent areas with moderate competition can produce above-average returns.
San Antonio Deep Dive
San Antonio is the volume leader in Texas by a wide margin with 127 units analyzed. The average opportunity score is 39 with a wealth score of 37. Those are both below the statewide average, and it's worth understanding why.
San Antonio is a big, spread-out city with a median household income of $65,897 — below the Texas average. It's also a competitive auction market with a lot of active buyers, especially on StorageTreasures. High competition and moderate-income demographics push scores down. Most units are landing in the 30-45 range, which means they're not bad — just not exceptional.
For San Antonio buyers, the play is volume and discipline. You're not going to find 60+ scores regularly here. Instead, you're looking for units in the mid-40s that you can pick up at a reasonable price, process efficiently, and turn a modest profit on each one. The math works when you're consistent, not when you're swinging for home runs.
That said, the top score recorded in our entire Texas dataset came from a San Antonio analysis — a 74. Even in moderate markets, standout units appear. The key is having a system that flags them when they do, so you're not relying on luck to spot them in a sea of average listings.
Score Texas auctions before you bid. AuctionData analyzes units on StorageTreasures, LockerFox & StorageAuctions using AI image analysis and neighborhood wealth data — the same scoring that generated every number on this page.
How to Use This Data
Numbers on a page are only useful if they change how you buy. Here's how I'd apply this Texas data practically.
- Check the heat map first. Before bidding on any Texas unit, look at the AuctionData Heat Map to see how that facility's area compares on wealth and activity. A unit in Spring Branch and a unit in Arlington require different bidding strategies even if the photos look similar.
- Don't chase volume markets blindly. San Antonio has the most listings, but it also has the most competition and moderate scores. If you can travel to Seguin, Burleson, or smaller-market facilities, the data suggests better opportunities per unit.
- Use wealth scores to set bid ceilings. A wealth score above 60 means you can bid slightly more aggressively — the expected item quality supports higher purchase prices. Below 30, keep bids tight and focus on units where the AI sees specific high-value items.
- Watch the suburbs. Burleson, Keller, Converse, Spring Branch — suburban facilities in Texas consistently show better wealth scores than urban core locations. This pattern holds across most states we track.
For a deeper look at reading unit photos before you bid, check out the guide on how to read a storage auction unit. And if you want to understand how the AI scoring works under the hood, there's a full breakdown in the post on AI storage auction analysis.
Texas is a big state with a lot of storage auction activity, and we're still building out coverage beyond the San Antonio metro. As more users run analyses in Houston, Dallas, Austin, and other markets, this dataset will grow. I'll update this page as the numbers change. For now, if you're buying in Texas, the data says: look past the obvious high-volume markets, pay attention to wealth scores, and let the smaller cities surprise you.